Hotel F&B month-end P&L — one source file, three report packs. Data stays on your device.

Import CSV, XLSX or PDF. Get Corporate, Owner and Property packs plus outlet detail — USALI-aligned, $199 once, no cloud upload.

The sample data is free to run. Exporting and the full packs need a licence.

InHouse P&L — Report A, Corporate
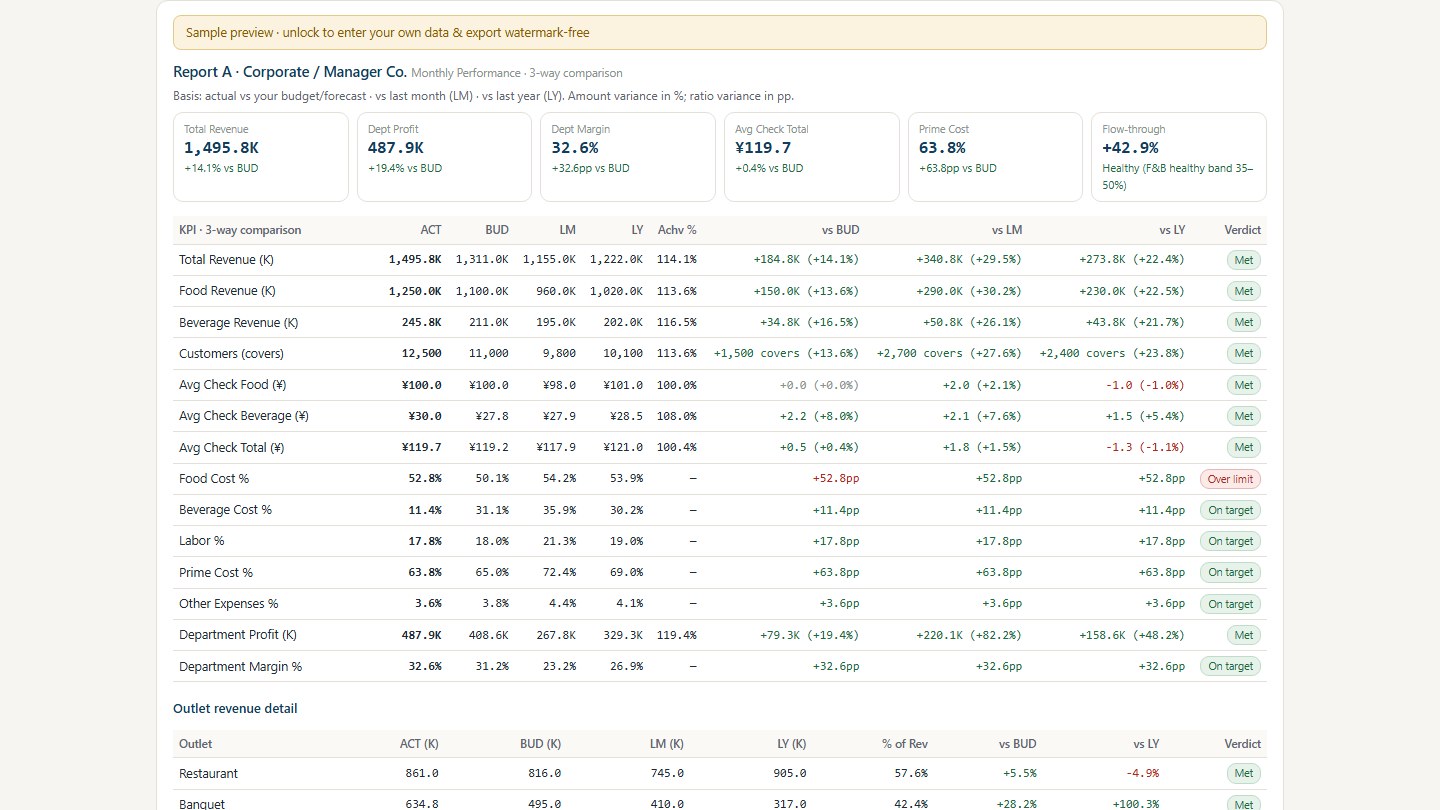
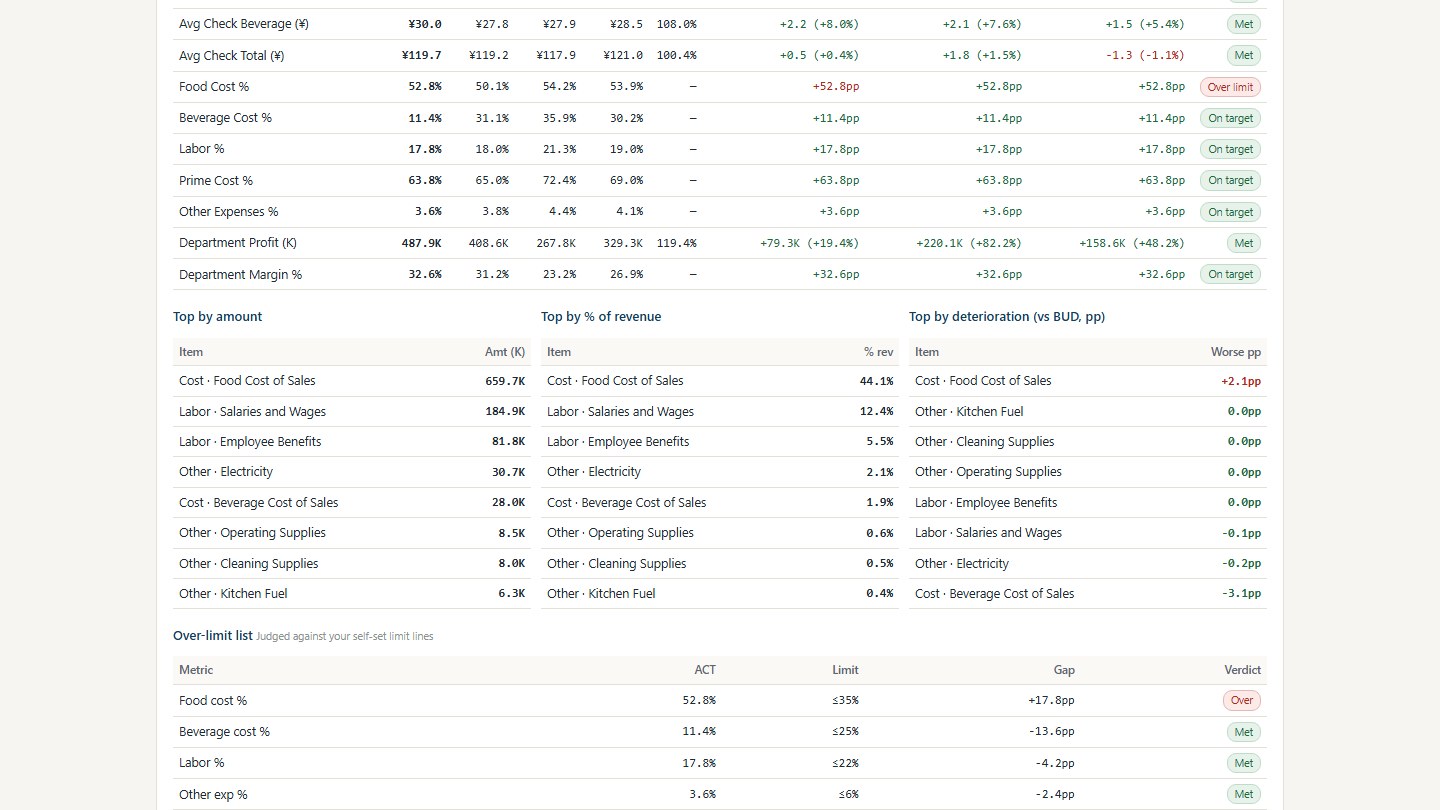
Report A, Corporate — the real tool, running on the built-in example.
  • Local-firstRuns in your browser; the only outbound request is the licence check
  • USALI-alignedAccount sequence follows the 11th edition
  • $199 oncePerpetual licence, no subscription, no per-room fee
  • English + 中文Every screen, note and export in the language you switch to
Product one · the month that has closed

InHouse P&L / Hotel — USALI-aligned month-end reporting for a hotel’s F&B division

Import the month-end export once — CSV, XLSX or PDF — and the app writes Report A for the group and management company, Report B for the owner, Report C for the hotel team who have to fix things on Monday, and Report D, the outlet appendix that breaks the division down by restaurant, bar, room service and banquet hall. Every line traces back to a row in your own file. Everything from here down to the next divider belongs to this product.

Capabilities

Built for the monthly close, not for a dashboard demo

Three things a Director of Culinary actually needs the week after month-end.

Monthly close in, reports out

Drop in the month-end export — CSV, XLSX or PDF. The importer maps every line to the USALI account sequence locally: nothing is retyped, nothing is uploaded.

Export CSV for finance, or print and save as PDF for the management meeting — every export is rendered by your own browser.

Setup · which reports

Currency and unit are labels

Pick the currency symbol and the amount unit (K, M or as entered). Every figure shows the unit you chose, and no FX conversion is ever applied — so converting can never introduce a second error.

Monthly archive and year-to-date

Every closed month is kept locally as an archive. Reopen any month, or accumulate from January to produce the year-to-date view and the annualised outlook.

How it works

See how it works

Four steps, one month-end file, no implementation project. Click through the steps below.

Which switch unlocks what? The manual lists every setting in the tool, what it gives you, and where it sits out of the box.

Prefer stills? Six steps, screen by screen — every frame is the real tool running on the built-in example.

Walkthrough · 4 steps Step 1 of 4

Real output snapshots — what the reports actually look like — are in the Sample output section below.

Real screens

The tool itself, five screens

Screenshots, not mock-ups: every frame below is the tool running on its built-in example. The first two are setup, the last three are the three report packs. The step-by-step explanation of each screen is in Six steps, screen by screen.

Setup · header and period
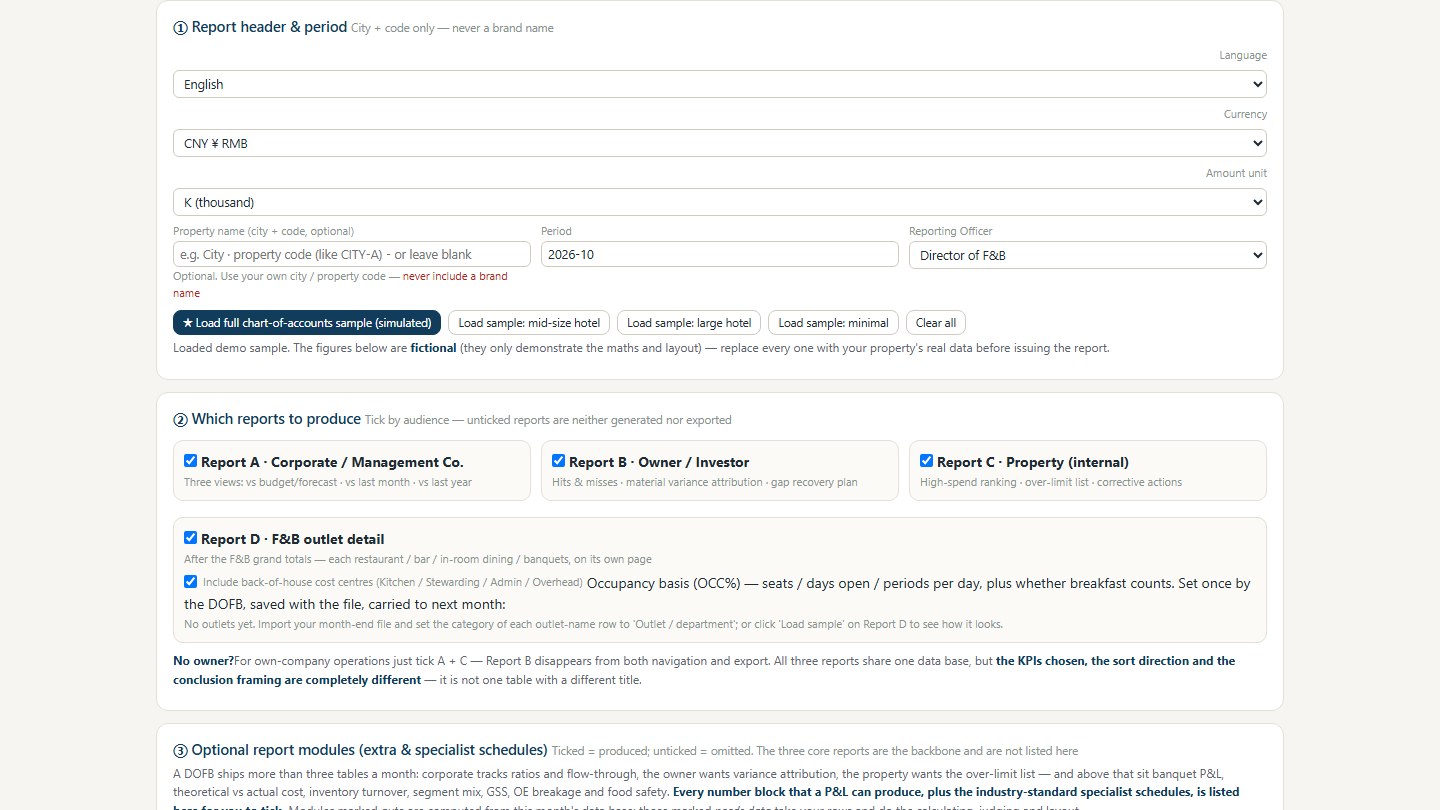
Setup · header and periodCity plus code, period, currency and amount unit. Load the built-in example and every field fills itself.
Setup · which reports
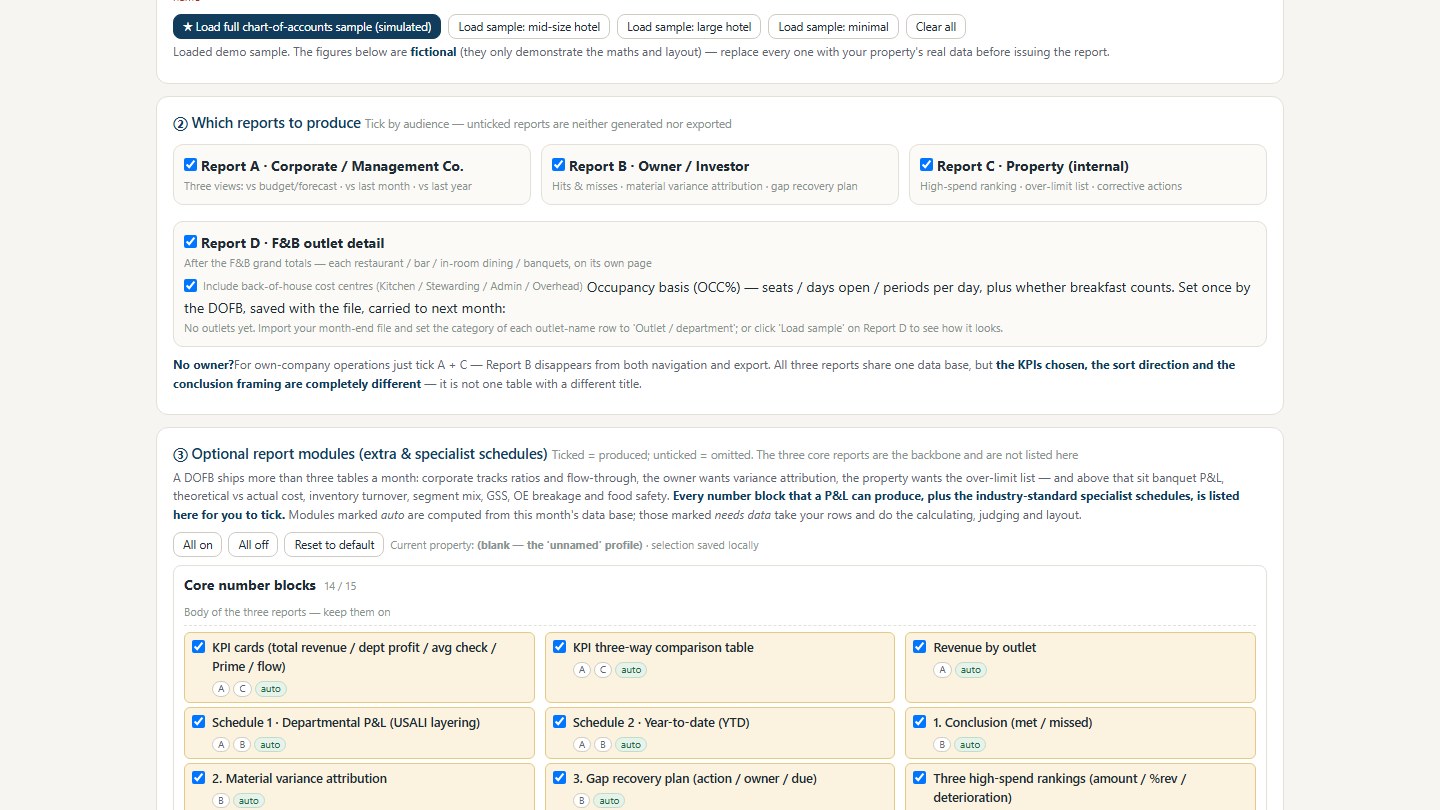
Setup · which reportsTick the readers you report to — A group, B owner, C property — plus the optional items. Anything unticked is not produced.
Report A · Corporate
Report A · CorporateSix KPI cards, then ACT / BUD / LM / LY columns with three-way variance and the achievement call.
Report B · Owner
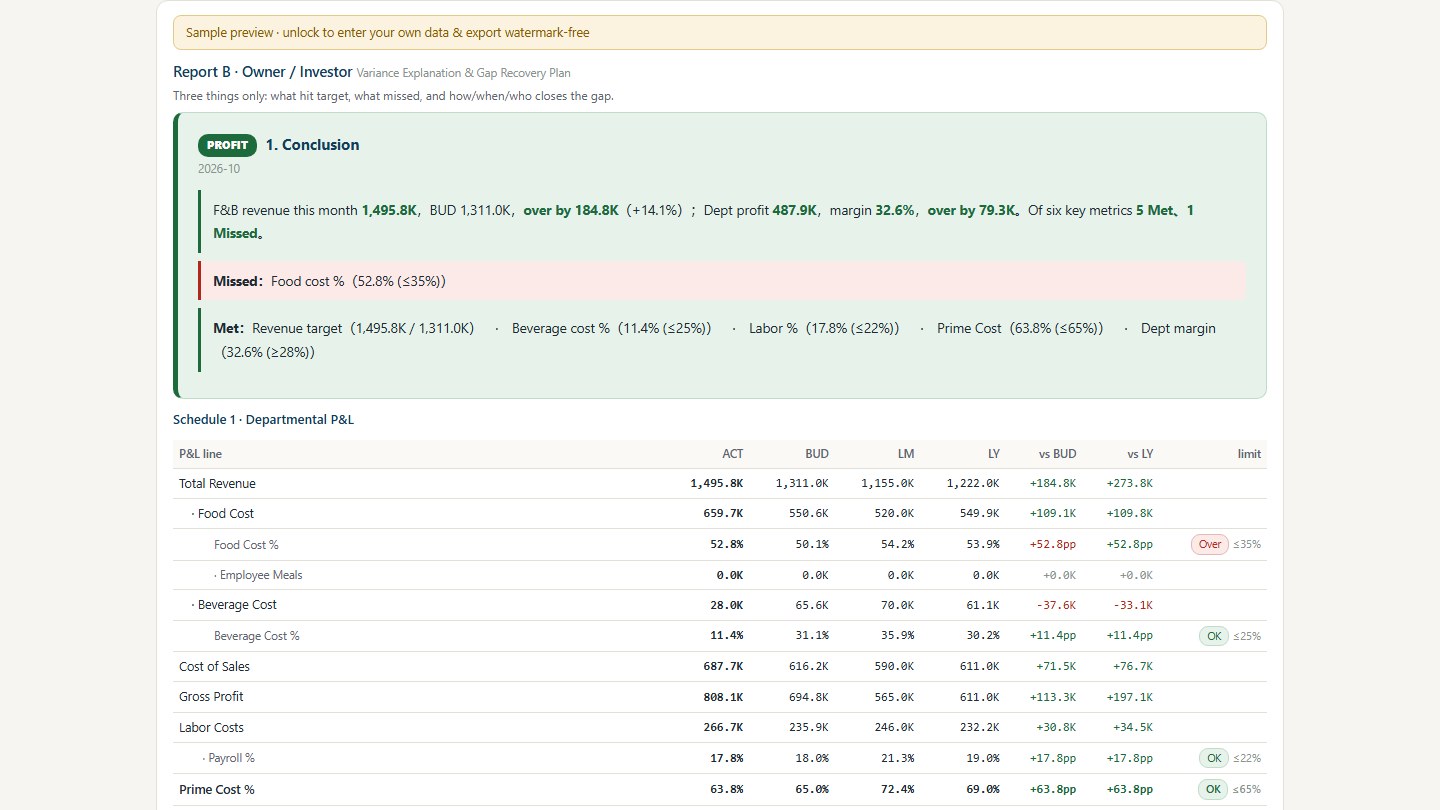
Report B · OwnerOpens with a written verdict, then Schedule 1 by department, with the red-line tests underneath.
Report C · Property
Report C · PropertyThree sorted tables — by amount, by ratio, by how far the line slipped — and the list of lines that crossed a limit.
1 / 5
Three readers · one close

One month-end file, three report packs — actual vs budget, last month and last year

The group wants achievement and comparability. The owner wants a verdict and a plan to close the gap. The hotel team wants the list that goes on the wall on Monday. All three come from the same file and the same calculation, so they cannot contradict each other.

Report D · F&B outlet detail is a report of its own, on one condition. It splits the division down to each restaurant, bar, room service and banquet hall — revenue, food, beverage, cost of sales, payroll, other expenses and department profit, each against budget, last month and last year, with kitchen, stewarding and administration carried as net cost. The condition is your month-end file. If that file already breaks the F&B division down by outlet, this whole page is built in one pass on import. If it carries the division as a single total, there is nothing to split: you can still key each outlet in by hand under Setup ⑦, but what comes out is an appendix you assembled yourself, not one the file produced — and the page says which on its source line. Switch it off in Setup if you do not report at that level.

Every report listed below belongs to at least one pack. Switch one off and it leaves every pack it appears in.

The product

Every report, and which pack it lands in — outlet P&L detail included

Every report below comes out of the same month-end file. The codes match the report engine exactly, so what you see here is what appears in Report A (group / management company), Report B (owner / investor), Report C (the hotel team) and Report D (the outlet-level detail, which rides along with the owner and property packs). The engine labels them Report A · Corporate, Report B · Owner, Report C · Property, Report D · F&B Outlet Detail.

Sample output

What the output actually looks like · static snapshots

These are reports the app really produced. They are static snapshots — written into this page, with no live link to the workspace. Once you're in, you'll see the same structure with your own numbers.

Anonymised sample property · F&B Department Closed
MetricActualvs Budgetvs Last Year

Illustrative figures derived from a real full-service hotel F&B month. Open the app to run your own numbers.

Revenue, all revenue centres
34,544,556
CNY · 12 revenue centres
Department profit, revenue centres
13,574,108
CNY · 12 revenue centres
Cost centres, net spend
4,519,115
CNY · kitchen / stewarding / admin / overhead
Departments broken out
16
12 revenue centres + 4 cost centres

F&B departmental breakdown · revenue centres

One card per outlet, with ACT / BUD / LY columns; only the ACT column is reproduced here.

OutletRevenueFood revenueBeverage revenueGross profitDepartment profitCoversAverage checkSeats
Main Restaurant6,195,6135,740,65824,2233,458,2991,293,46545,895135.00190
Italian Restaurant1,325,8811,070,675136,516982,114405,0643,252407.71135
Chinese Restaurant3,795,3043,010,472183,1962,850,2581,886,2335,963636.48136
Local Restaurant3,940,6203,187,616208,0102,920,5491,319,75416,139244.17136
Other Restaurant 11,692,5061,464,27457,2931,197,367515,8399,062186.77176
Market1,195,7721,102,2716,093720,867383,8303,818313.1958
Lounge1,681,341509,432374,2611,361,225956,51414,489116.0494
Entertainment Club2,797,563221,0102,354,4621,997,898604,3268,899314.37185
Room Service297,485232,63136,766201,851151,5533,46485.88—
Minibar127,592112,72114,871104,646104,646———
Banquets8,123,7106,122,039272,2286,236,8034,546,26724,460332.12—
Membership3,371,169——3,371,1691,406,617———
Total · 12 revenue centres34,544,55613,574,108

Cost centres · net spend only

The kitchen, stewarding and administration carry no revenue lines, so they show payroll plus other expenses only — that is the net cost.

Cost centrePayroll S&WOther expensesNet costFTE
Overhead1,690,069569,4882,259,55734.9
Administration719,72943,715763,4445.8
Kitchen850,82087,109937,92925.3
Stewarding119,520438,665558,1853.8
Total · 4 cost centres4,519,115

Figures are a desensitised sample derived from a real full-service hotel P&L: no property name, no city, no brand. Amounts are in CNY yuan.

Product two · the month you are standing in

F&B Reforecast — where the month in progress lands

Same shop, the other moment. InHouse P&L reports a month that has closed; Reforecast works on the month you are standing in: it freezes the days that already happened, rolls the rest to the last day at the pace this month has actually run, and splits the gap to budget into volume and price. One file in, printable tables out, calculated in your own browser.

35 seconds, silent, recorded from the tool itself. The figures in the clip are the tool’s built-in synthetic example, not any property’s actual numbers.

What it does

  • In: one CSV — a row per outlet per meal period, with revenue, cost, payroll, budget, last year, covers and rooms on the books.
  • Out: four tables — month-end landing, variance to budget, the pace the rest of the month has to run, and the four ownership modes side by side.
  • Days that already happened are never smoothed. Weekdays and weekends are rolled separately, so an average cannot flatten the shape of the month.
  • Variance is split into volume and price, so you know who to ask before you write the note.
Price and checkout — coming soon

A figure goes up here only when it is the figure we will charge, so this one stays unwritten until then: the price and the payment link appear together, in one update. Nothing is a pre-order and nothing is charged. Several properties are quoted per property, so ask before planning a roll-out: support@inhousepl.phjmmc.com.

One CSV, 21 columns

One row is one outlet in one meal period: revenue, cost, payroll, budget, last year, covers, rooms already on the books. Fill the template, or save an existing sheet as CSV — there is no POS or PMS connector to install.

What already happened is frozen

Days before the cut-off go in exactly as they are — no smoothing, no rewriting history. The rest rolls to month-end at this month’s realised daily pace, weekdays and weekends separately, so an average cannot flatten the shape of the month.

Four tables you can hand over

Month-end landing, variance to budget, the pace the rest of the month has to run, and the four ownership modes side by side. Every variance is split into volume and price, so you know who to ask before you write the note.

Calculated in your own browser

Import and calculation run without a licence; the activation window appears when you export CSV. The one network request is the licence check and it carries no figure. The next two months are labelled a statistical baseline, not a forecast we promise.

First screen · three months side by side
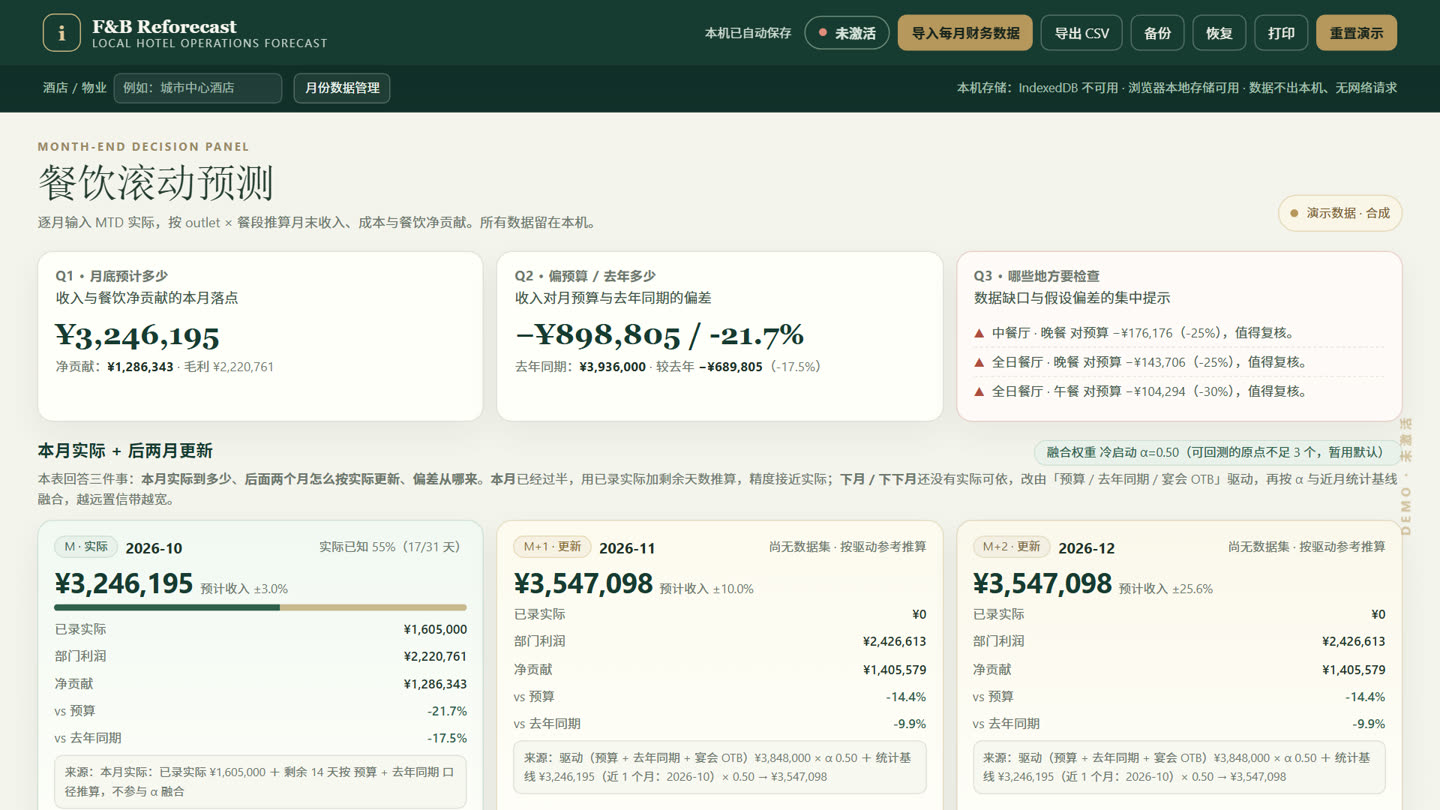
First screen · three months side by sideLoad the example and M / M+1 / M+2 sit on one screen: this month for the landing, the next two flagged as a statistical baseline.
Bridge · variance to budget
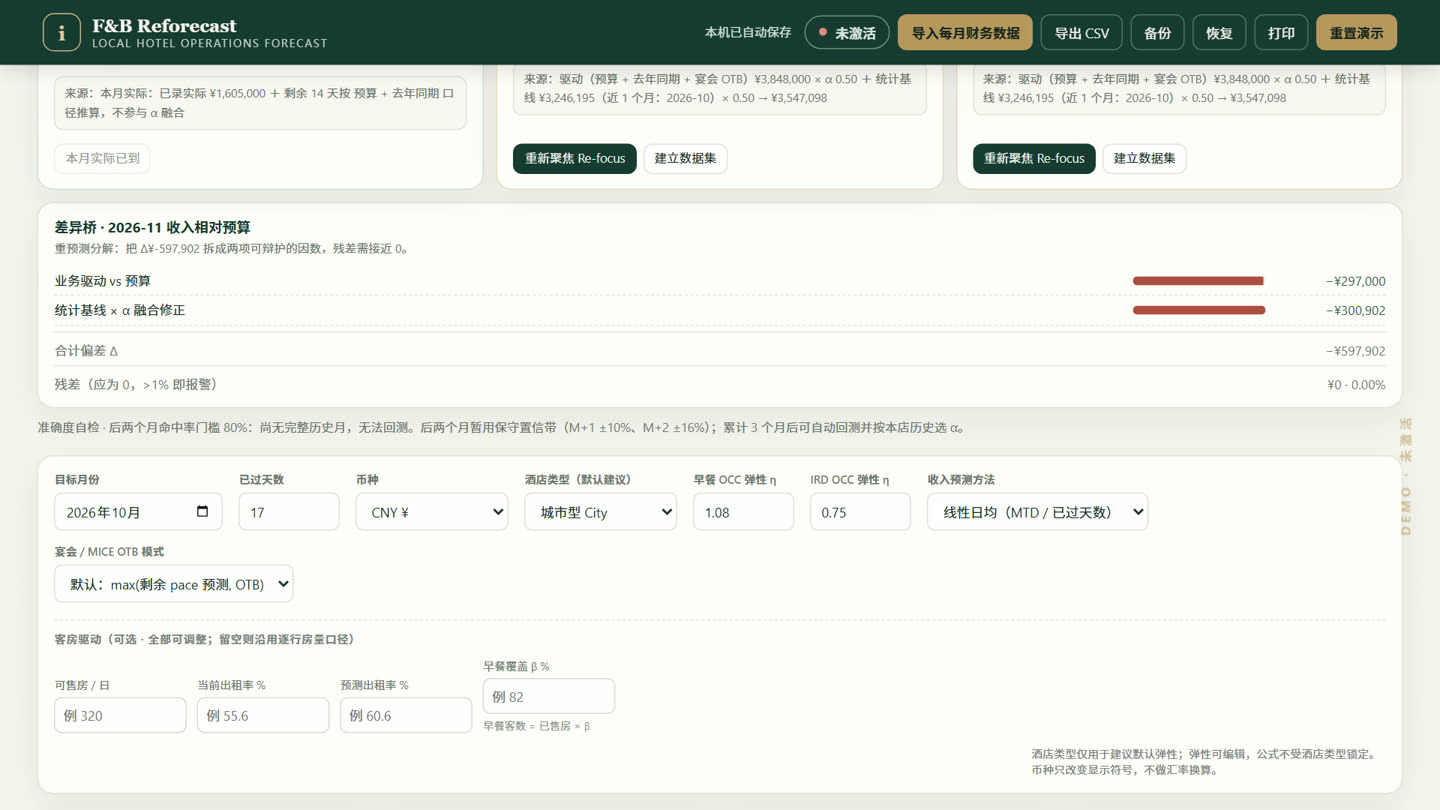
The bridgeThe gap to budget split into two: what the business can still win back, and what can only be accepted on the statistical baseline — and a residual line that has to stay at zero.
Four figures
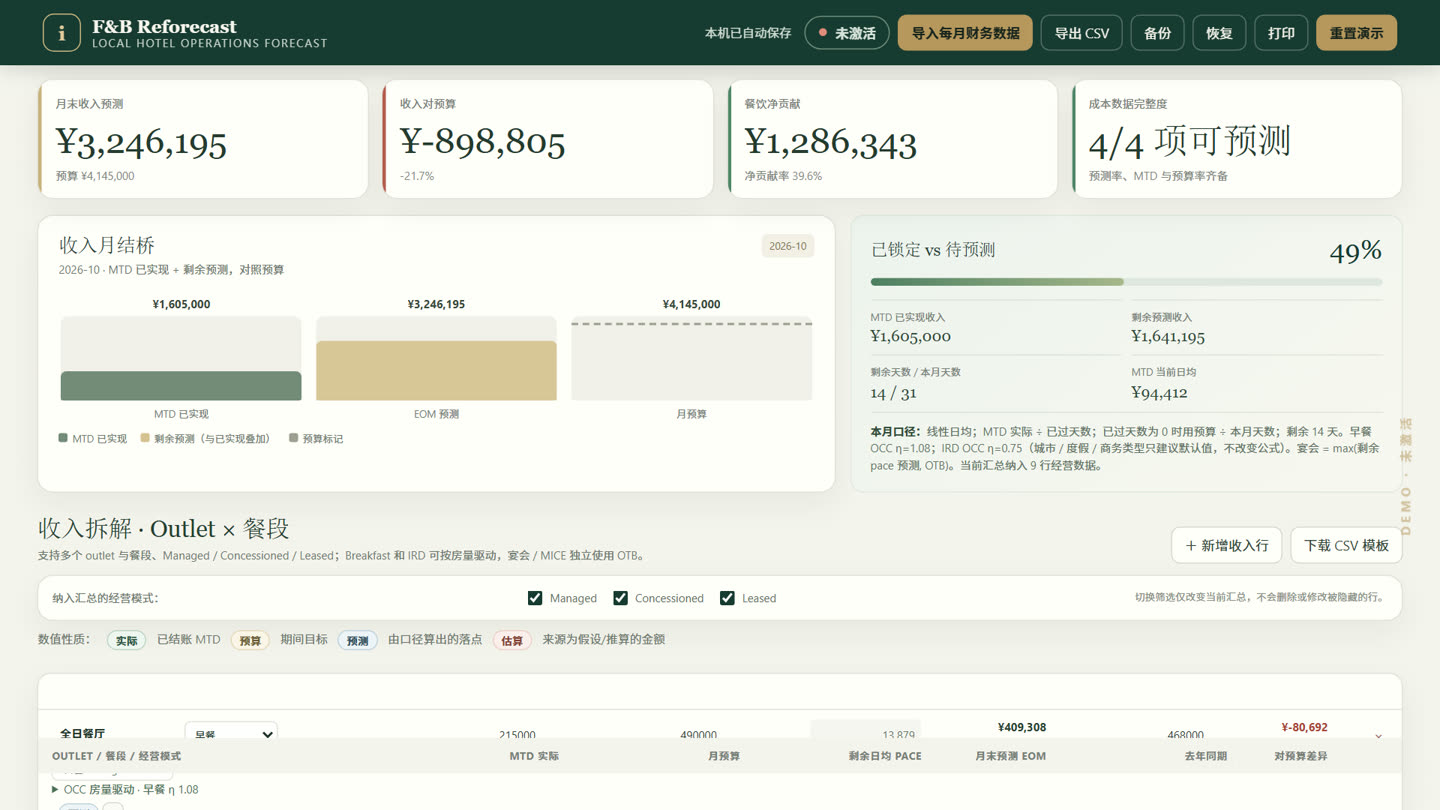
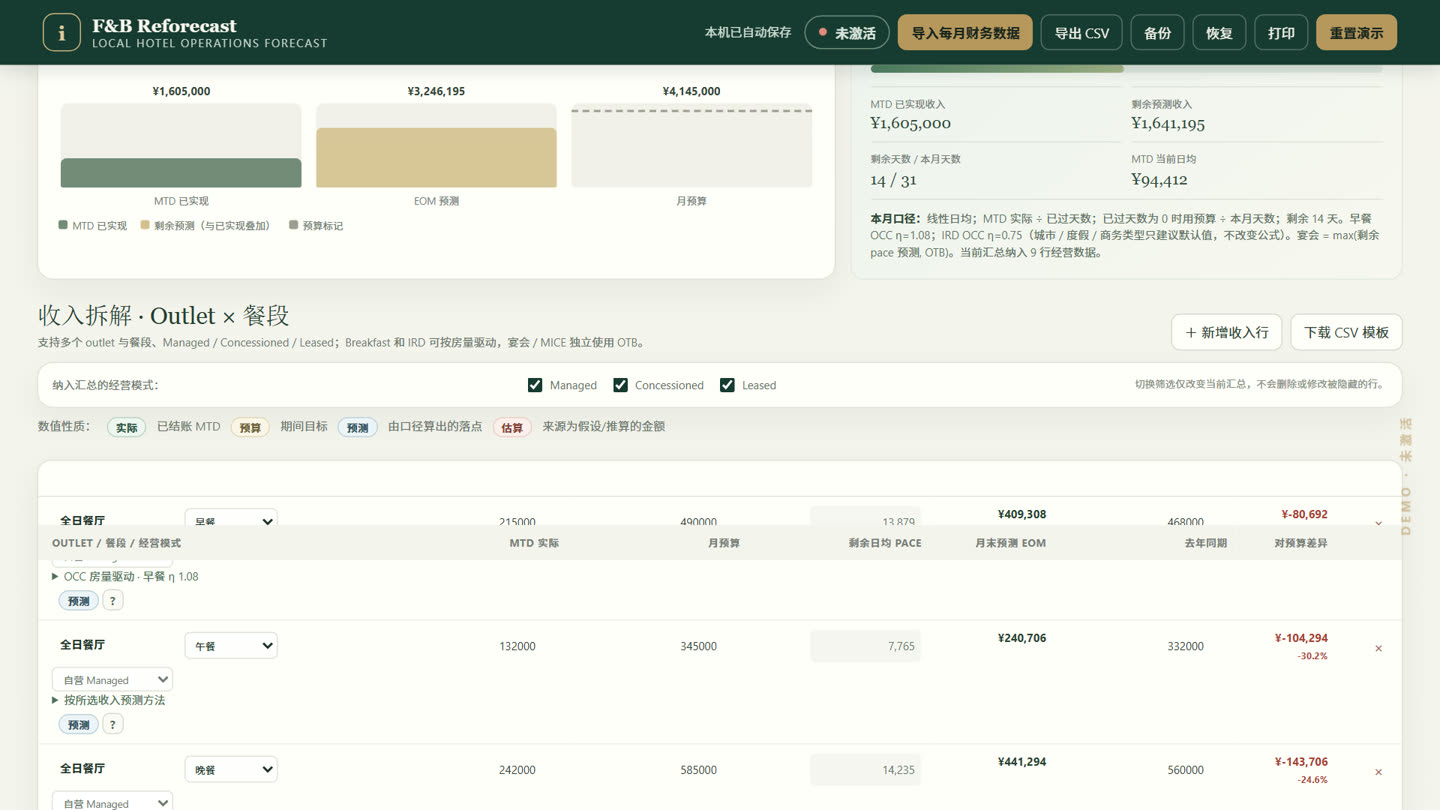
Four figuresMonth-end revenue forecast, variance to budget, F&B net contribution, and how complete the cost data is — one line each, nothing to dig through.
Revenue by outlet and meal period
Revenue by outlet × meal periodRow by row: MTD actual, month budget, the daily pace left to run, month-end estimate, last year and the variance. The gap lands on a row before anyone discusses the reason.
Cost and net contribution
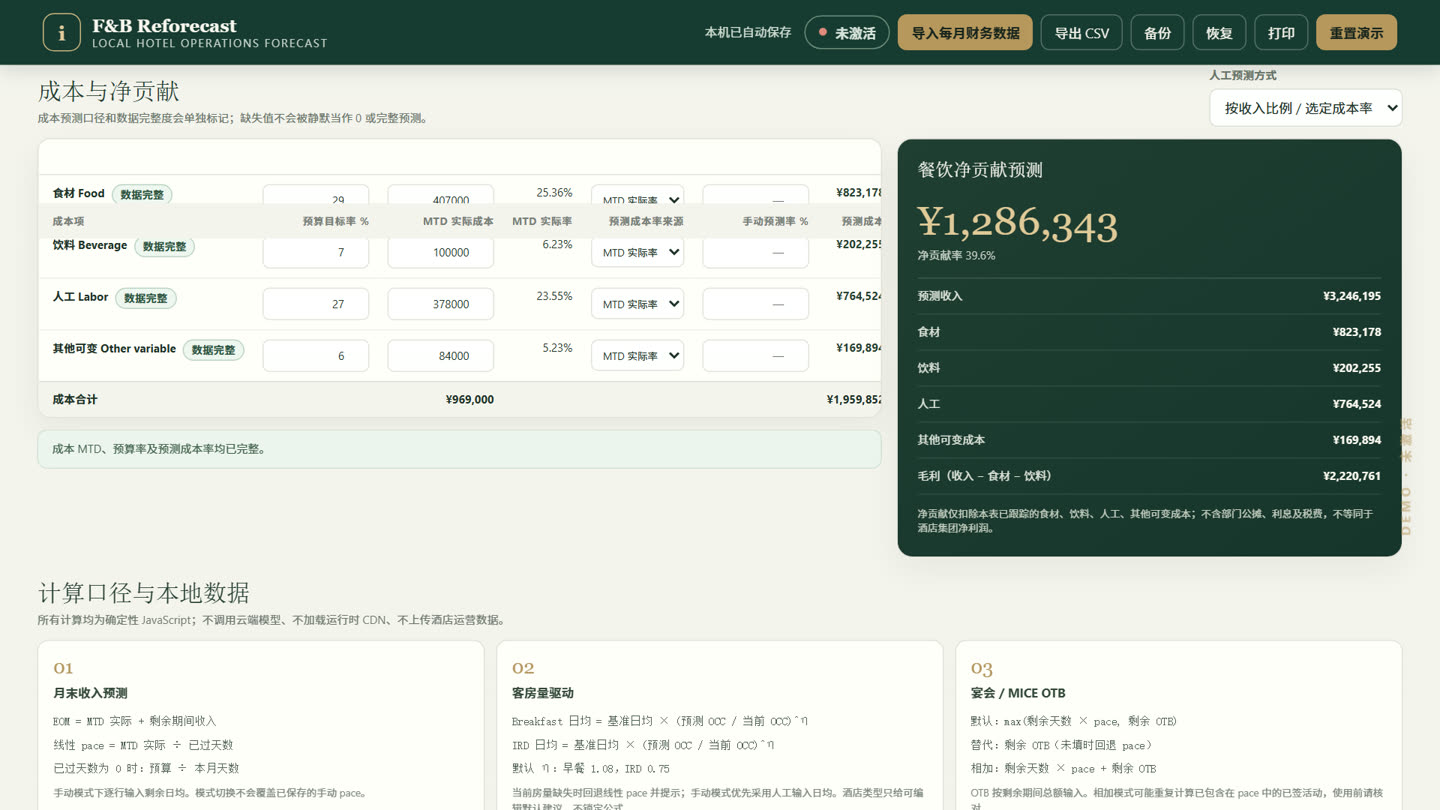
Cost and net contributionFood, beverage and payroll are forecast from their month-to-date share; the net-contribution card on the right breaks the gap down item by item.
Method printed on the page
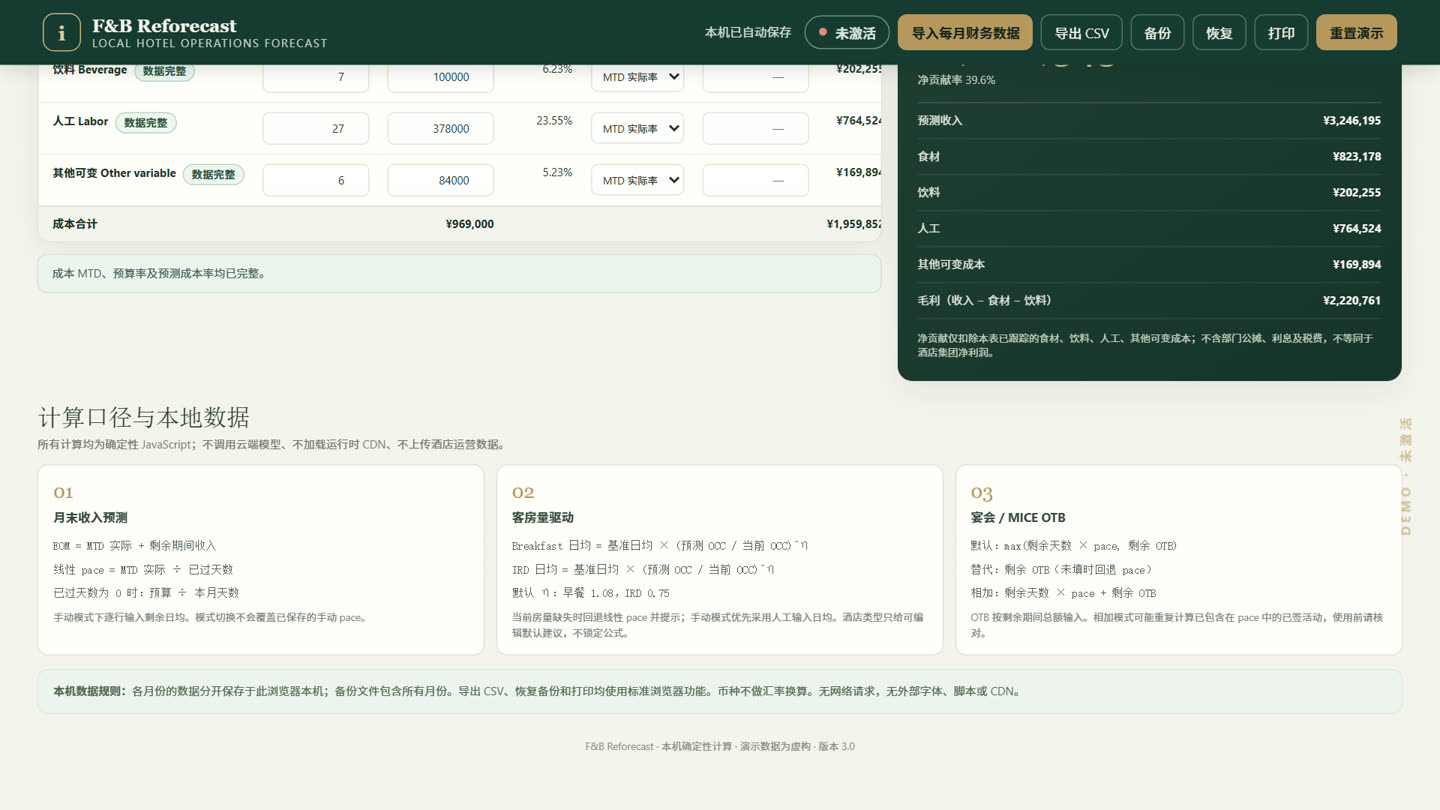
The method, printed on the pageThe three formulas behind the numbers sit on the screen, not in a document: month-end revenue, the room-revenue driver, and the banquet / MICE on-the-books rule. The data stays in this browser.
1 / 6

First screen · three months side by side

Load the example and M / M+1 / M+2 sit on one screen: this month for the landing, the next two flagged as a statistical baseline.

The bridge

The gap to budget split into two: what the business can still win back, and what can only be accepted on the statistical baseline — and a residual line that has to stay at zero.

Four figures

Month-end revenue forecast, variance to budget, F&B net contribution, and how complete the cost data is — one line each, nothing to dig through.

Revenue by outlet × meal period

Row by row: MTD actual, month budget, the daily pace left to run, month-end estimate, last year and the variance. The gap lands on a row before anyone discusses the reason.

Cost and net contribution

Food, beverage and payroll are forecast from their month-to-date share; the net-contribution card on the right breaks the gap down item by item.

The method, printed on the page

The three formulas behind the numbers sit on the screen, not in a document: month-end revenue, the room-revenue driver, and the banquet / MICE on-the-books rule. The data stays in this browser.

Who it is for

  • An owner running one property, who wants to know in the middle of the month whether it is slipping — before deciding on a promotion or a cut in variable cost.
  • An F&B or rooms analyst who owes a variance note at month-end and would rather draft it while there is still room to act.
  • Someone covering several properties: one file each, so you can see who is covering whom and who is dragging.

Who it is not for

  • Anything expecting to pull numbers straight out of a POS or PMS — it is all fill-in or import, there is no connector.
  • Group consolidation — this licence is single-property; several properties are quoted per property.
  • Budget-setting software — it works the budget you type in, it does not set the budget for you.
Buy $199
Pricing

One-time licence. No per-room fees, no subscription.

Two products, each licensed on its own. InHouse P&L is $199 for a one-time personal licence. F&B Reforecast is sold separately and its price is coming soon — the figure and the payment link go up together, in one update.

InHouse P&L

English + 中文 interface
one-time · perpetual licence

Your career moves. It moves with you.

  • One import, every report in the pack, no re-keying and no second spreadsheet
  • The three reports the meeting asks for: Corporate · Owner · Property
  • Finance's Excel, CSV or PDF goes straight in — the F&B block is cut out for you
  • It judges only against the red lines you set. It never decides for you.
  • Your figures never leave your laptop: no account, no cloud, nothing to cancel
  • Every screen, every note, every export and the printout in the language you switched to

One named user · every device you personally work on · and it is yours, not the hotel's

For the F&B or finance person who runs several outlets alone — and takes the tool with them when they move.

Get InHouse P&L — $199

Checkout is handled by a merchant of record. No card form on this site.

F&B Reforecast

Coming soon
Price and checkout — coming soon

Where the month you are standing in lands.

  • Month-end landing, variance to budget, remaining pace, four ownership modes
  • Days that already happened stay frozen; the rest rolls at this month’s real pace
  • One 21-column CSV in — no POS or PMS connector to install

Same licence shape as InHouse P&L: one named person, the devices you personally work on. Several properties are quoted per property.

See what it does

Every InHouse P&L licence includes

  • One director — the licence follows you, not the hotel
  • Every report pack, including the outlet appendix and banquet P&L
  • Three years of version updates, last one kept for good
  • Weekday email support, usually within 2 business days
  • Desktop, tablet and mobile browsers
How to order

How to order — Professional licence

There is no card form on this page. Checkout happens on the licensed payment platform: the platform — not the operator — is the seller on your receipt. Once you have a licence, load it on the tool page — no download required.
Licence holder · the way in, every time

You already hold a licence — this is where you use it

After your first payment you get a licence key — the text block the checkout hands you. Every later session starts the same way: paste that key here. This page is the only door, and the workspace has no login of its own. Once the signature checks out, the tool unlocks offline. There is no file to look for. The master key works the same way.

· Verified on your own device: Ed25519 against a public key embedded in this page
· Report data is never uploaded or stored — it stays in this browser
· Once verified, the tool opens fully — departmental breakdown included
· Returning users do the same thing: paste the key again — that key text is the only link between this page and the tool, and nothing else is exchanged
External requests from this page: 0
Contact

Talk to the person who built it

Email:support@inhousepl.phjmmc.com
Weekdays 09:00-17:00 (GMT+8)
Response time:Best effort. Most questions are answered within 2 business days, Beijing time (GMT+8). We do not guarantee a response time.
What to send:A redacted month-end export — CSV, XLSX or PDF. Line items may be blanked; we only need to see the structure.
Not included:24/7 cover, on-site installation, custom report development, accounting system integration or guaranteed response times